Market Statistics & Graphs for Washington County

If you're like me, you like to understand the market conditions and trends. The graphs provided below show year-over-year statistics, so you can try to find the trends.

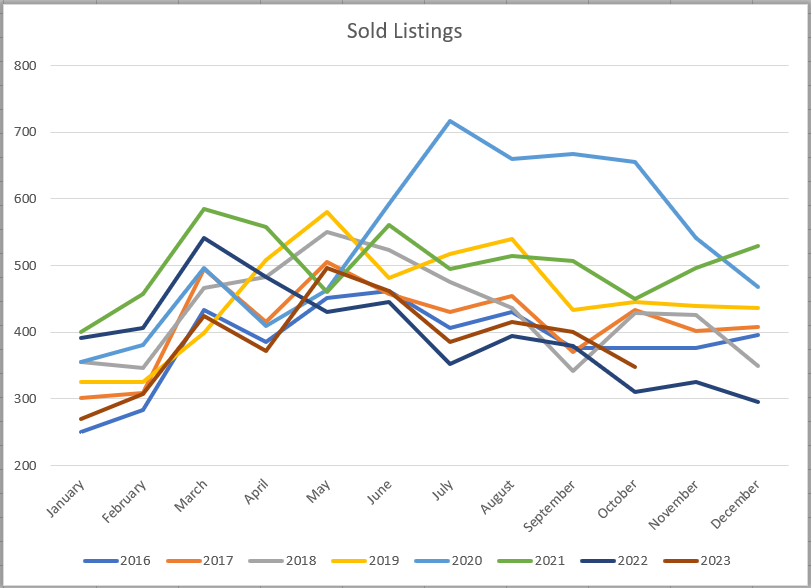
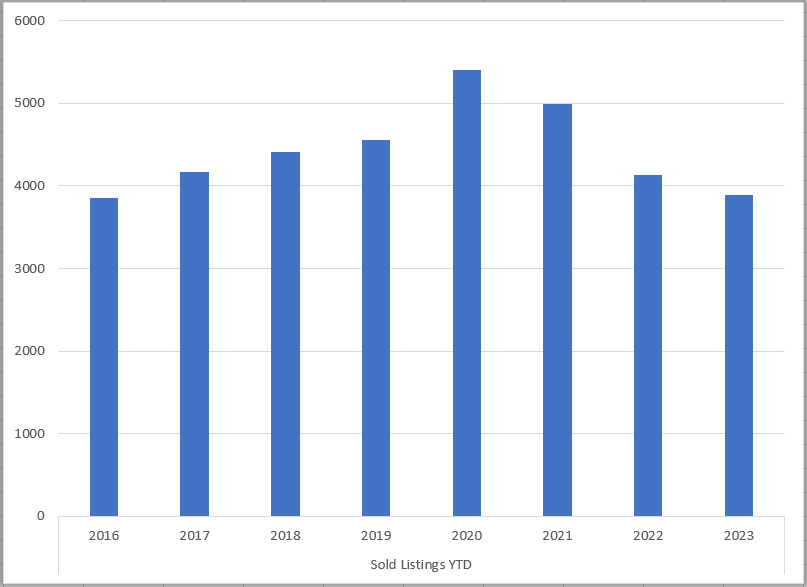
This graph shows the number of homes sold by month, year-over-year. You'll see that homes were selling like hotcakes during 2020, and in 2023 we're still selling lots of homes, but we're on the lower end of average.

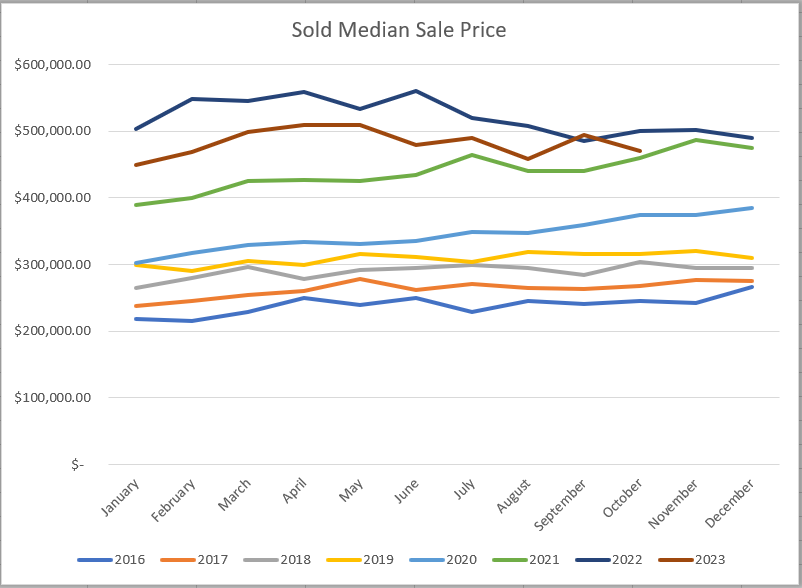
This graph could be studied for far too long! It's very interesting seeing how values increased while homes were under high demand in 2020-2022!

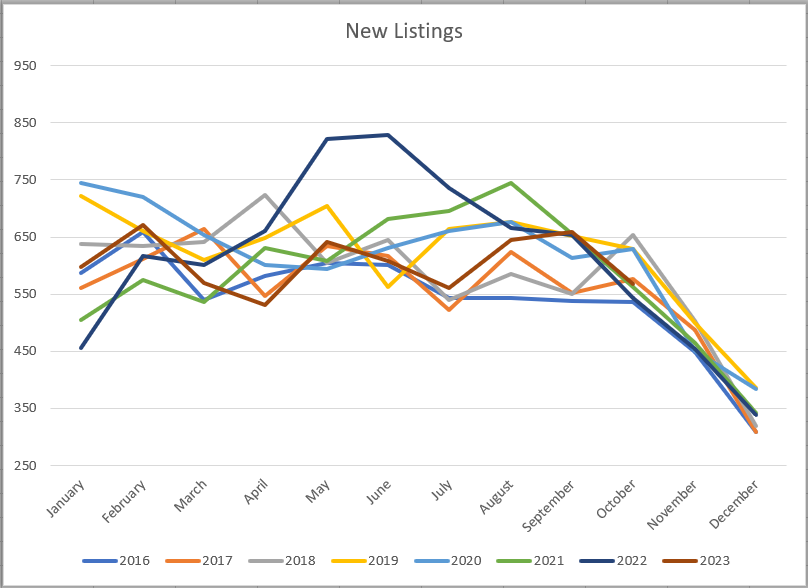
The biggest take-away from this graph is that people don't like to have their homes on the market during winter!

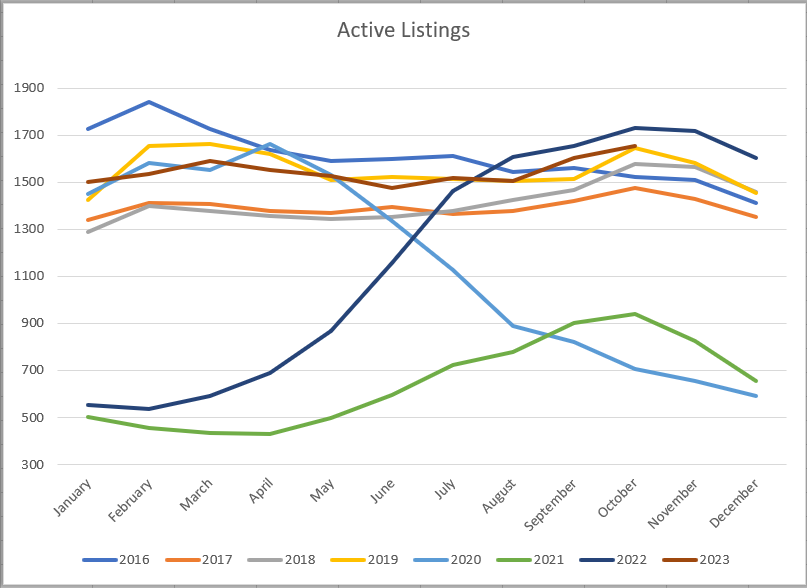
This graph shows that inventory has recovered from the crazy market we saw in 2020-2022.

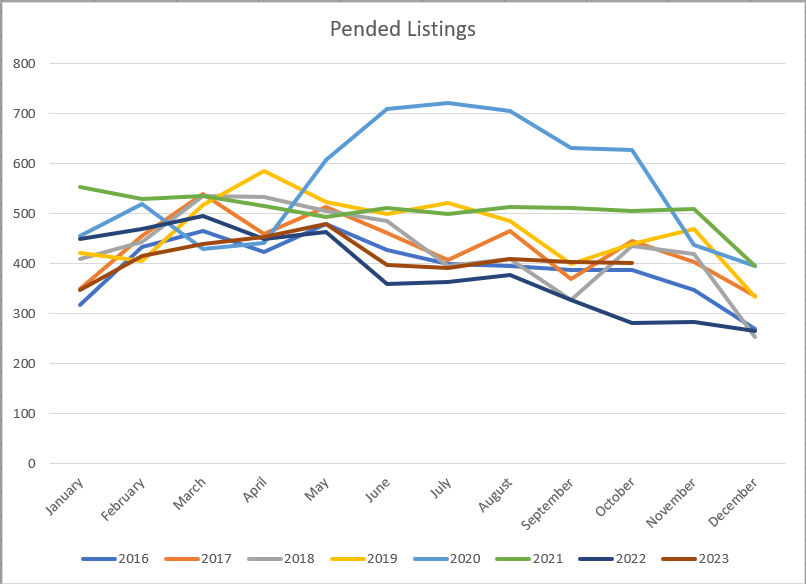
This graph has it's pros and cons. It shows how many listings went pending during the month. There are always some contracts that fall-through, so not all of these turn into sold listings, but it still gives you an idea where the market is going.

You'll see that the higher values, and higher interest rates have slowed down sales, but yet, homes are still selling!

Lets face it, not everyone is as crazy about 'numbers' as I am. If you want to work with someone who seriously understands this real estate market, give me a call!

Cody Pitcher
SHC
Coldwell Banker Premier Realty
(435) 669-6118  |  8440079-SA00   |  cody@sguhomes.com